Counter-Strike 2 (CS2) replaced the classic net_graph command with Valve's Telemetry system built into the Source 2 engine. CS2 players monitor FPS, ping, packet loss, and server variance (var) through three methods: in-game Telemetry settings, console commands like cl_showfps, and the Steam overlay. All three methods work across every CS2 version released to date. Performance troubleshooting through these tools helps competitive players identify network instability and hardware bottlenecks before they affect match results. Stable performance metrics are just as critical for those who follow the competitive scene — from tracking pro stats to placing CS2 bets on tournament outcomes.
Key Takeaways
- Telemetry Settings display FPS, ping, packet loss, and frame time through Settings > Game > Telemetry
- Console Commands (cl_showfps 1 through cl_showfps 5) provide adjustable detail for FPS and server data
- Steam's FPS Counter offers a lightweight alternative via Steam Settings > In-Game
Understanding the Changes from CS:GO to CS2
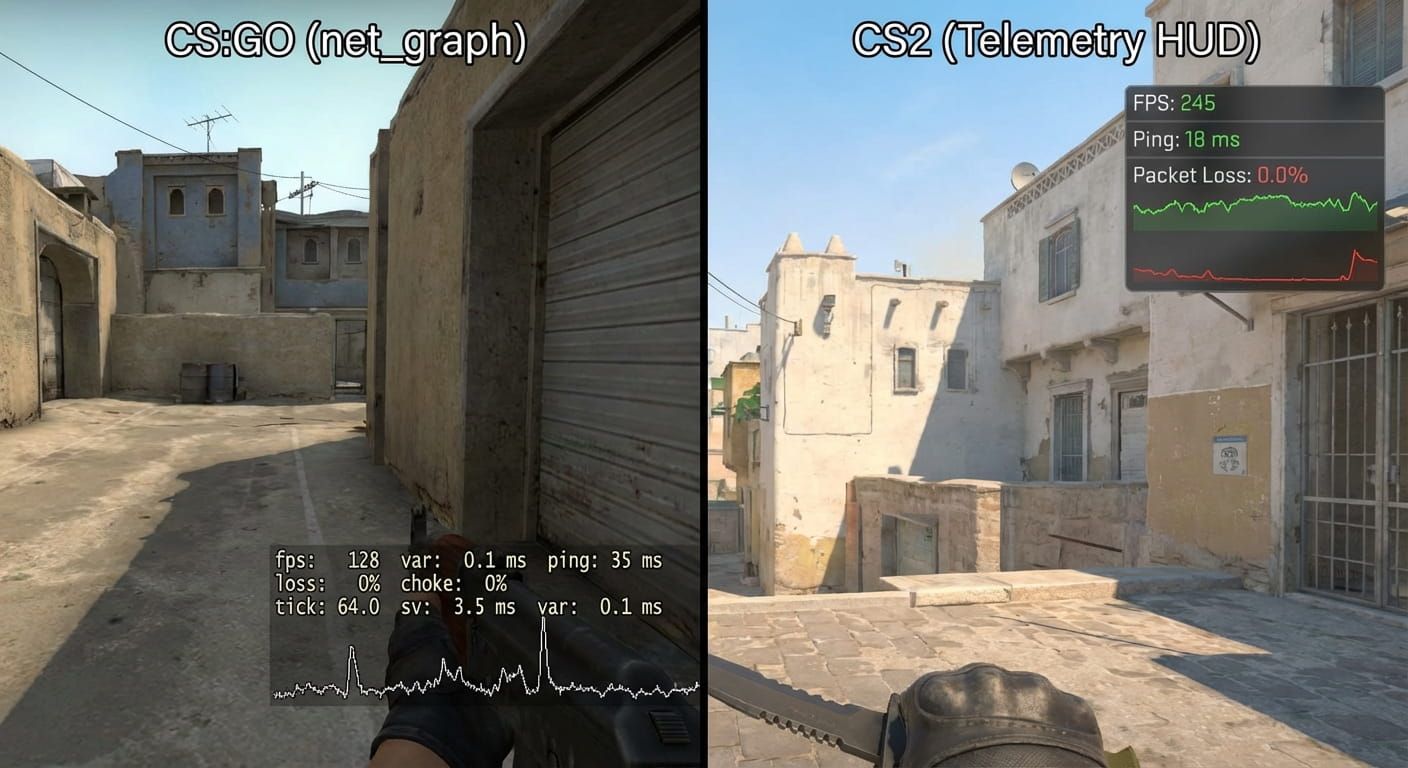
Valve removed the net_graph 1 command when CS2 launched on the Source 2 engine. Typing net_graph 1 in the CS2 console returns an "Unknown command" error because Source 2 uses a different performance monitoring architecture. The Telemetry system replaces net_graph with individual metric toggles, cleaner graphs, and additional tracking for frame time and server variance. These additions provide more granular diagnostics than CS:GO's single-overlay net_graph displayed.
Method 1: Using In-Game Telemetry Settings
CS2's Telemetry system is Valve's official replacement for net_graph, accessible from the settings menu without console commands.
Step-by-Step Guide to Finding Telemetry Settings
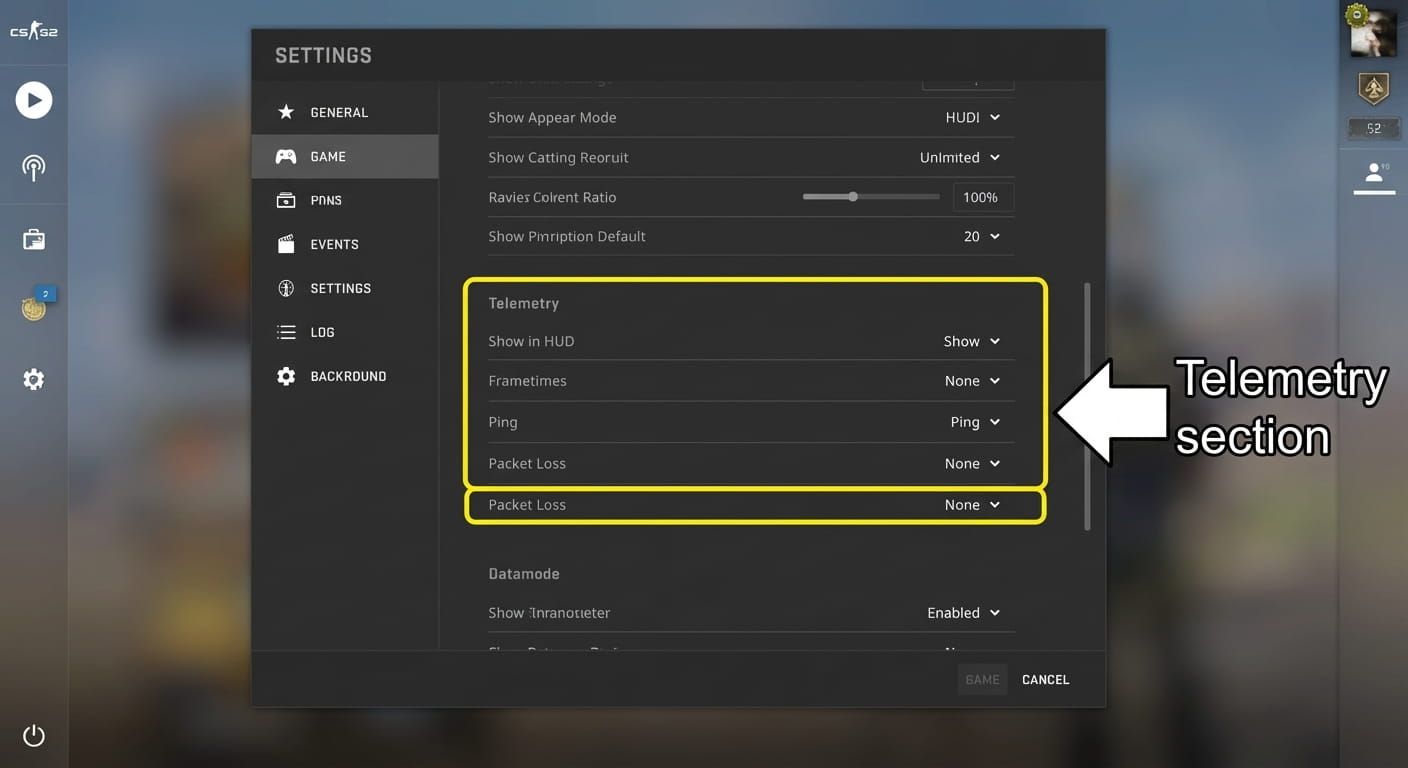
- Open the CS2 main menu and click the gear icon to enter Settings.
- Select the "Game" tab at the top of the settings panel.
- Scroll to the bottom of Game settings to locate the Telemetry section.
- Set each Telemetry option ("Show FPS and Frame Time," "Show Ping," "Show Packet Loss/Misdelivery") to "Always" or "Match Only."
Customizing Your Telemetry Display
Each Telemetry option accepts three values: "Always" (visible in menus and matches), "Match Only" (in-game only), and "Never" (disabled). PGL Major tournament competitors typically set all options to "Always" for continuous monitoring during practice sessions. Casual players can select "Match Only" to reduce HUD clutter while keeping in-match data visible. The Telemetry display position is fixed to the top-right corner of the screen by default.
Verifying Your Telemetry Settings Work
Launch any CS2 match or offline game after enabling Telemetry, then check the top-right corner for FPS, ping, and packet loss readouts. Missing values indicate that one or more Telemetry options remain set to "Never" in the Game settings menu. Restarting CS2 resolves cases where Telemetry changes do not appear immediately after saving.
Method 2: Using Console Commands
The Developer Console gives advanced players direct command access to FPS counters and network diagnostics in CS2. Enable the console by navigating to Settings > Game and setting "Enable Developer Console" to "Yes," then press the tilde key (~) during gameplay.
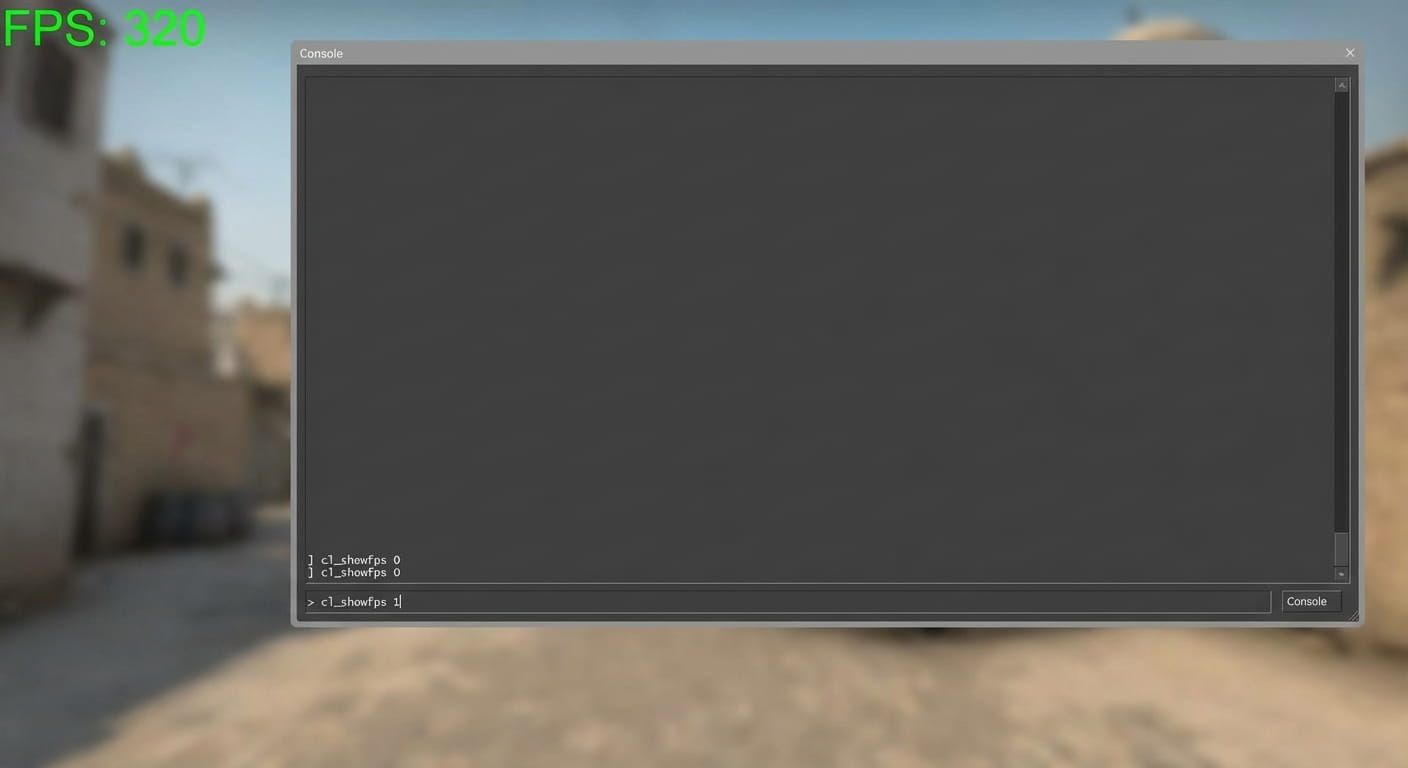
The cl_showfps command serves as the primary FPS monitoring tool, while cq_netgraph 1 activates a separate network graph for latency, packet loss, choke, and server tick rate. Combining cl_showfps 1 with cq_netgraph 1 replicates most data from CS:GO's original net_graph overlay.
| Command | Output |
| cl_showfps 0 | Disables the FPS counter |
| cl_showfps 1 | Basic FPS counter (current frame rate) |
| cl_showfps 2 | FPS with minimum and average statistics |
| cl_showfps 3 | FPS plus server timing (tickrate, frame drops) |
| cl_showfps 4 | Full profiling overlay with CSV logging |
| cl_showfps 5 | Extended profiling with additional server data |
Advanced Console Command Options
Binding cl_showfps to a toggle key eliminates repeated console entries each match. Enter "bind n toggle cl_showfps 0 1" to assign the N key as an on/off switch for the FPS display. For permanent activation, add +cl_showfps 1 to CS2's Steam launch options or create an autoexec.cfg file in the CS2 cfg folder.
Additional Telemetry console commands provide per-metric control:
- cl_hud_telemetry_frametime_show 2 activates frame time display
- cl_hud_telemetry_ping_show 2 activates ping display
- cl_hud_telemetry_net_misdelivery_show 2 activates packet loss display
Customizing Your Net Graph Display
CS2's Telemetry HUD renders in a fixed top-right position by default, and Valve does not currently provide native settings to reposition, resize, or adjust overlay transparency through the Game menu. Console commands offer the only available display control: setting each cl_hud_telemetry parameter to 0 hides that specific metric, while a value of 2 shows the metric at all times.
Players who want a scoreboard-only view can bind Telemetry toggles to the Tab key using alias commands, keeping performance data hidden until the scoreboard opens. PGL Major competitors commonly use this bind approach to minimize visual clutter during live rounds.
Disabling Net Graph in CS2
Turning off performance overlays in CS2 requires reversing the activation steps for each method.
For Telemetry settings: open Settings > Game > Telemetry and switch "Show FPS and Frame Time," "Show Ping," and "Show Packet Loss/Misdelivery" to "Never." All three options must be changed individually because CS2 does not provide a single master toggle for the Telemetry display.
For console commands: type cl_showfps 0 to disable the FPS counter. Enter cl_hud_telemetry_frametime_show 0, cl_hud_telemetry_ping_show 0, and cl_hud_telemetry_net_misdelivery_show 0 to remove each Telemetry metric. The command cq_netgraph 0 disables the network diagnostic graph.
For the Steam overlay: navigate to Steam > Settings > In-Game and set "In-game FPS counter" to "Off."
Command-Specific Troubleshooting
| Problem | Solution |
| Console does not open with ~ | Set "Enable Developer Console" to "Yes" in Game settings |
| "Unknown command" for net_graph | Use cl_showfps 1 or cq_netgraph 1 (net_graph was removed in CS2) |
| Commands reset after restart | Add +cl_showfps 1 to Steam launch options or create autoexec.cfg |
| Display overlaps HUD elements | Disable third-party overlays (Discord, GeForce Experience) |
Method 3: Using the Steam Overlay
Steam's built-in FPS counter offers a lightweight alternative that displays only frames per second without ping or packet loss data. Enabling the Steam counter takes four steps:
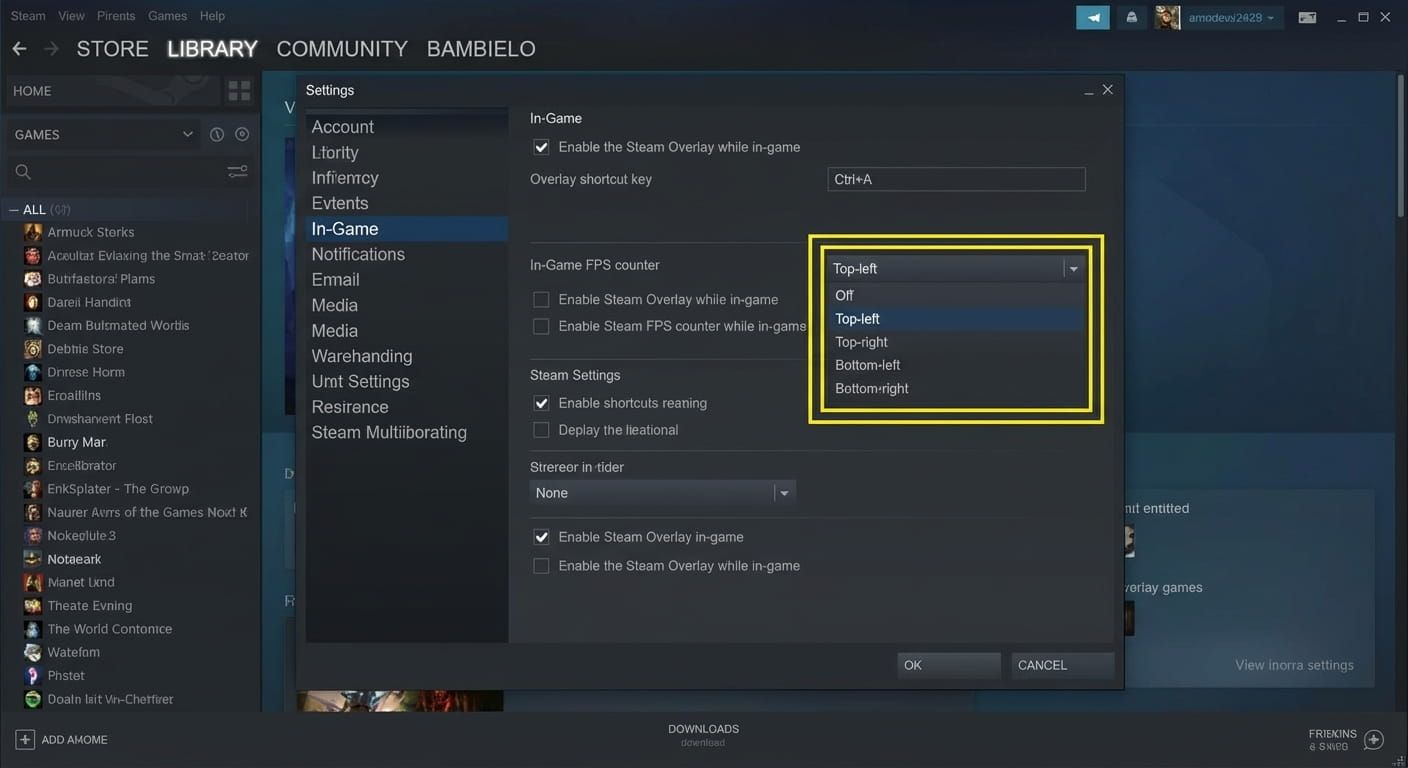
- Open the Steam client and navigate to Steam > Settings.
- Select "In-Game" from the left sidebar.
- Set "In-game FPS counter" to a screen position (top-left, top-right, bottom-left, or bottom-right).
- Enable "High contrast color" for visibility against dark CS2 backgrounds.
Steam's overlay produces zero measurable performance impact, while third-party alternatives from NVIDIA or AMD typically reduce FPS by 1 to 2%.
Verifying Steam Overlay Display
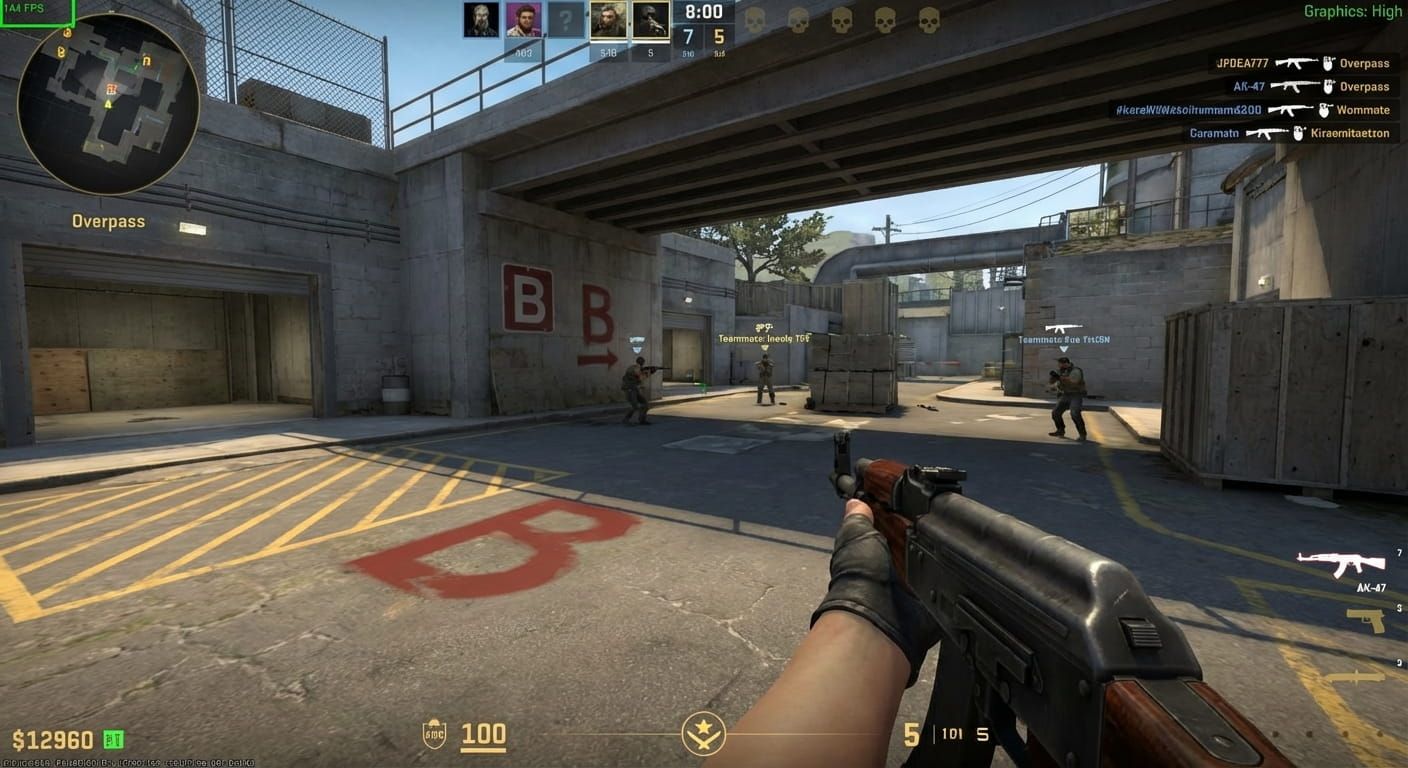
Launch CS2 after enabling the Steam FPS counter and confirm the frame rate appears in your selected corner of the screen. Players running fullscreen who see no counter should verify "Enable the Steam Overlay while in-game" is toggled on under Steam > Settings > In-Game. Switching to borderless windowed mode resolves most remaining overlay display conflicts with fullscreen applications.
Interpreting Your Performance Metrics
FPS (Frames Per Second) measures how many frames your GPU renders each second. Tournament competitors at PGL Major events target 144+ FPS to match 144Hz monitor refresh rates, while values below 60 produce visible stuttering and input delay. Ping measures round-trip delay to the game server in milliseconds, where values under 50ms deliver responsive gameplay and anything above 100ms degrades shot registration accuracy.
Packet loss tracks the percentage of data that fails to reach the server or return to the client during gameplay. Even 1% packet loss triggers rubber-banding and destabilizes ping through forced data retransmissions across the connection. Server variance (var) measures how consistently the game server maintains its tick rate, with values below 1ms optimal for competitive play. Monitoring these four metrics together reveals whether performance issues originate from your hardware, your network, or the game server.
Optimal competitive values for CS2 performance:
- FPS: 144+ (matching monitor refresh rate)
- Ping: below 50ms
- Packet loss: 0%
- Server variance (var): below 1ms
Once your CS2 performance metrics hit these targets, put your optimized setup to work. Register on PLG.bet and test your skills on provably fair Originals like Crash and Roulette.
Troubleshooting Common Issues
Telemetry not appearing after activation requires verifying each option individually under Settings > Game > Telemetry. Confirm all three toggles read "Always," then restart CS2 if changes fail to apply. Console commands producing errors usually indicate the Developer Console remains disabled in Game settings.
Players who encounter "Unknown command" messages are entering CS:GO syntax (net_graph 1) rather than valid CS2 commands (cl_showfps 1, cq_netgraph 1). All Telemetry and cl_showfps commands function identically across every CS2 version, so update-related display failures are unlikely.
Conclusion
CS2 offers three verified methods to display performance data: Telemetry settings for full FPS, ping, packet loss, and var monitoring; console commands (cl_showfps, cq_netgraph) for granular control; and Steam's overlay for basic frame tracking. PGL Major tournament players rely on these same tools to diagnose connection issues before they affect competitive results. Create your PLG.bet account in under two minutes and start playing Originals with your tuned CS2 setup.